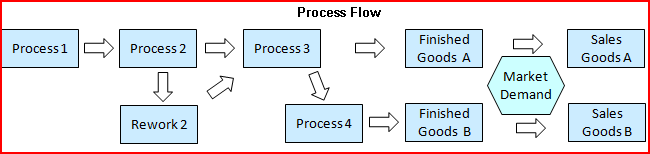
| • The
process flow is described by a transition rates between processes that can
vary with time. |
| – The model
tracks yield units and percent and scrap units and percent for each process
stage. |
| – Each process has capacity limits determined by the number of
pieces of processing equipment. |
| – Transition rates can vary with time. This particular model has
transition rates that are constant over time. |
| – You can input outsourced units into any stage in the flow. |
| (The model inserts
outsourced units only in Process 1 and in finished goods inventory at the
first time step.) |
| |
| • Tracks processing costs by process stage by type of cost input
by time period. |
| – Reports costs per unit in/processing/out and aggregate costs
in/processing/out for each stage. |
| – Allocate cost less salvage value of scrapped units to good
output units at each processing stage. |
| – Separate worksheets show costs with and without breakout of
material/labor/captial expense/overhead. |
| |
| • Tracks accumulated cost of a good unit entering and exiting
each stage by type of cost by time period. |
| |
| • Tracks units scrapped and cost of scrap at each process state
by time period. |
| |
| • Reports costs and accumulated costs per unit, by cost type and
by time period. |
| – Cost of a good unit
entering a process stage |
| – Cost of a processing a
unit at a process stage |
| – Cost of a good unit
exiting a process stage |
| – Cost of scarpped units
at each process stage |
| – Allocates cost less salvage value of scrapped units to good
output units at each processing stage. |
| – Separate worksheets show costs with and without breakout of
material/labor/captial expense/overhead. |
| |
| • Sales |
| – Sales of Products A and B are driven by market demand and
limited by available finished units. |
| – You can sell the
output of any process stage. (In this particular model, only output of two
stages are sold.) |
| |
| • Financial results: Model include prices, revenue COGS, and
gross margin for units sold. |
| |
| • Scenarios |
| – Handles multiple scenarios to compare alternative processes. |
| – This model has two scenarios in which Scenario 2 raises yields
and increases input costs in Process 3. |
| |
• The model includes Excel charts that provide graphical views
of key variables. These charts are part
of the model, and they are
included by default in exported Excel workbooks. You can add more charts,
import them, and the new charts
will be included in exported Excel workbooks. |